Antonin Bruneau is a Solution Engineer at StreamSets, based in Paris, France. He recently created a fun demo system showing how the StreamSets DataOps Platform can collect, ingest, and transform IoT data. Over to you, Antonin…
Traditional product blog posts explain how to solve complex problems you might find in your daily job, but today I want to show you how to have a fun time with StreamSets.
Who doesn’t remember having great fun racing slot cars, competing with your best friend, and epic car crashes?
In this blog post, I’ll show you how to add sensors to your race track with a Raspberry Pi, and then collect metrics in real-time and compute statistics about your races, using StreamSets Data Collector and StreamSets Transformer.
The Electronic Part
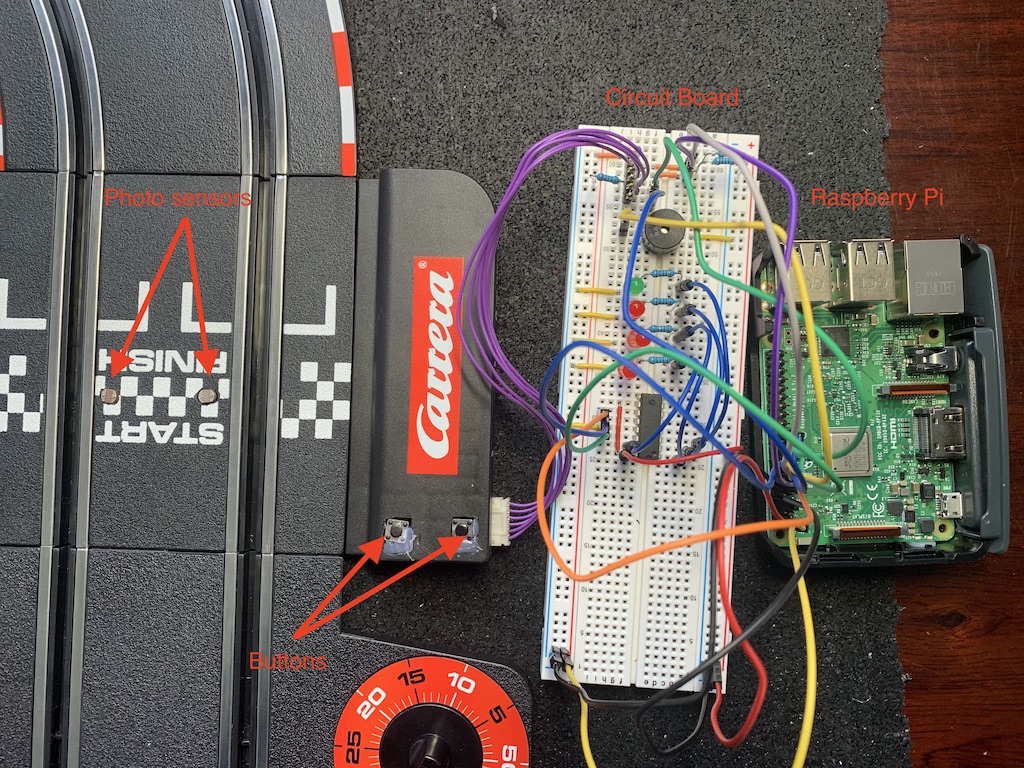
To measure your race performance, we are going to add sensors to the start/finish line of the race track, and some buttons to control the game. We will use a Raspberry Pi to collect the measurements and output the events to a file.
Details about the components, schematics, and code for the Raspberry can be found here: https://github.com/abruneau/hacking_electric_race_track.
Event Collection
Reading Data from the Raspberry Pi
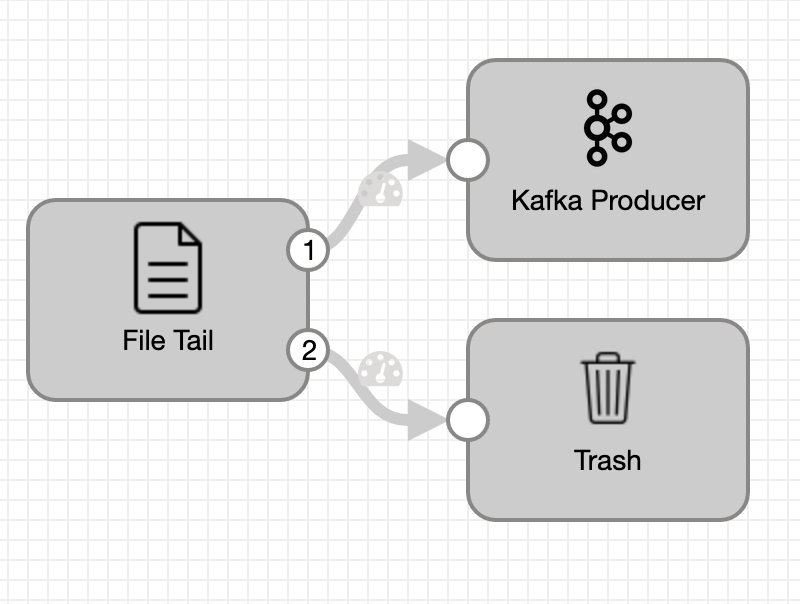
On the Raspberry Pi, a Python application reads the sensor and button events and writes them to a text file. Each line in the file is composed of a timestamp and an event number. To have a minimum impact on the device, we will use StreamSets Data Collector Edge to read the file and send the events to a Kafka topic.
Converting Raw Data to Game Information
In this second part of event collection, we will parse the raw data and store the results in MySQL tables. Here is the schema I used:
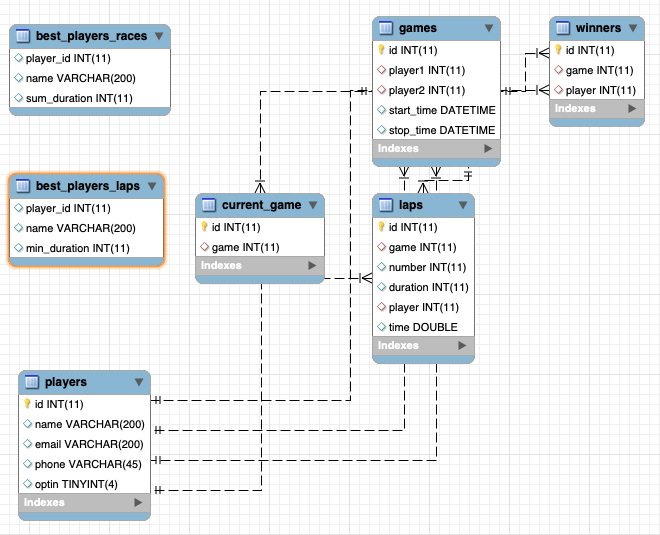
And here is the pipeline to read Kafka and write data to MySQL:

From Kafka, we receive a series of timestamps and event numbers:
- 0: race starts
- 1: sensor 1
- 2: sensor 2
- 3: race stops
- 4: reset race
A Stream Selector (‘dispatch events’ in the pipeline shown above) dispatches the events to different routes.
The start route (event 0) will retrieve the newly created game (see below how we create it with the API) and set the start time for it.
The sensor route (event 1 and 2) uses Redis to cache each sensor event timestamp and retrieve the previous one if it exists. If the sensor has been triggered before, we can calculate the duration of the lap and update the Laps table.
The stop route (event 3) retrieves the current game and updates the game table with the finish time. It also triggers two other pipelines. One Data Collector pipeline that will update the winner table, and a Transformer pipeline I will explain later.
The last one, the reset route (event 4), gets the current game and resets it by deleting all associated laps, resets the winner table, Redis, and start/stop time of the game.

The pipeline responsible for setting the winner is very simple. It uses a SQL query to find the user based on the game Id we pass in params and stores the results in the winners’ table. A Pipeline finisher stops it when the winner has been set and resets the origin.
Game Statistics
To add some more competition, a Transformer pipeline is used to compute statistics about the games.

This pipeline joins the players table with the laps table to rank players on their fastest lap and their fastest overall race. You could easily compute more statistics like average lap/race time, or player stats to measure progress. It is up to you to get creative.
This pipeline is triggered by the stop route of the Data Collector pipeline.
Exposing the Data
Now that we can collect the race track data, comes the question of exposing them. I could have chosen a traditional BI tool and plugged it into the database directly but I wanted something light that I could customize easily. So I created a small web app in Angular that queries an API to collect data.


I built the API using a Data Collector microservice pipeline.

This is a special type of pipeline that has a REST Service origin as input and sends back an HTTP response. I used an HTTP Router to route the event depending on the URL path. To retrieve the data, I used a series of JDBC Lookup processors, and Expression Evaluators to format the response. This blog post explains more about microservice pipelines, and contains a link to a tutorial.
Wrap Up
By using StreamSets, we were able to collect data on an IoT device, stream the events from Kafka, populate a database, compute statistics leveraging Spark, and expose data through an API.
Now it is your turn! Play it, hack it, share it!!
This GitHub repository contains a docker-compose file with StreamSets Data Collector and StreamSets Transformer, local Spark, Kafka (Lenses), and the Web UI: https://github.com/streamsets/slot_car_demo
The post Fun with Spark and Kafka: Slot Car Performance Tracking appeared first on StreamSets.


_Leona_Amarga.jpg)


.jpeg)